ZRT Laboratory’s Innovative Test Reports
for hormones, neurotransmitters, heavy metals and essential elements
ZRT's reports are the most meaningful because they combine the patient's test levels with self-reported symptoms that are then correlated into a set of individualized comments - all giving health care providers unparalleled insight into patient conditions.
Intuitive Graphics
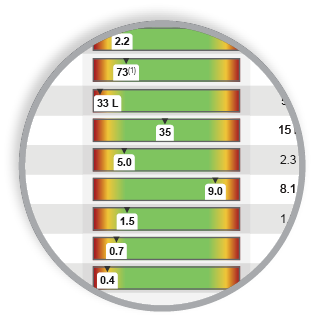
Intuitive graphics allow a provider to quickly scan a column of results and determine whether a patient's levels are high, low or ok.
Intuitive graphics allow a provider to quickly scan a column of results and determine whether a patient's levels are high, low or ok.
Patient Convenience
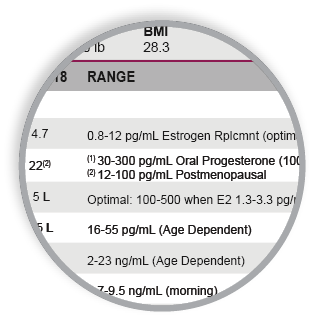
Patients do not need to stop hormone supplementation to use ZRT’s testing because ranges are adjusted for age, menstrual status and supplementation types - which is the ideal method for tracking the effectiveness of hormone treatments.
Patients do not need to stop hormone supplementation to use ZRT’s testing because ranges are adjusted for age, menstrual status and supplementation types - which is the ideal method for tracking the effectiveness of hormone treatments.
Detailed Graphs
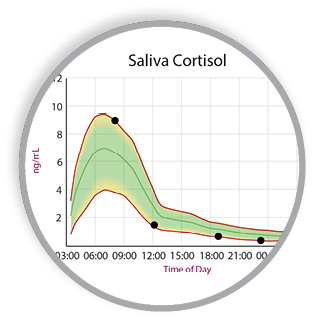
Graphs act as a visual aid for interpreting results and facilitating discussions with the patient. For hormones like cortisol and melatonin that are measured multiple times per day, results are plotted according to the actual time of day the sample was collected.
Graphs act as a visual aid for interpreting results and facilitating discussions with the patient. For hormones like cortisol and melatonin that are measured multiple times per day, results are plotted according to the actual time of day the sample was collected.
Symptom Tracking
Patients indicate how they are affected by 68 common hormone-related symptoms. The color-coded results give practitioners added insight into which symptoms are most troubling.
Patients indicate how they are affected by 68 common hormone-related symptoms. The color-coded results give practitioners added insight into which symptoms are most troubling.
Advanced Symptom Interpretation
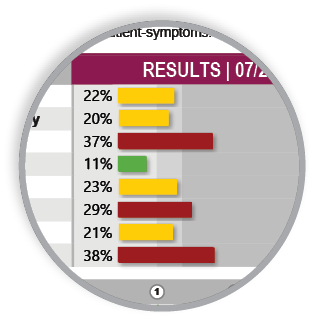
Patient symptoms are then summarized into 8 hormone imbalance conditions and scored with red, yellow or green bars to indicate severity. Learn more about ZRT's symptoms.
Patient symptoms are then summarized into 8 hormone imbalance conditions and scored with red, yellow or green bars to indicate severity. Learn more about ZRT's symptoms.
Clinically Informed Comments
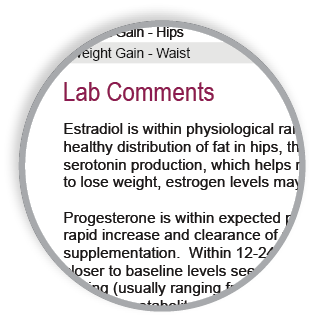
Individualized comments written by our clinicians and scientists address how a patient's results relate to his/her symptoms, resulting in the best and most targeted treatment plans.
Individualized comments written by our clinicians and scientists address how a patient's results relate to his/her symptoms, resulting in the best and most targeted treatment plans.
Tracking Progress is Simple
ZRT reports show current results, as well as up to three historical results - making it easy for practitioners and patients to see progress over time. Patient symptoms are also shown with histories, so it's easy to see when red bars change to green bars as patient health improves.
Take the Next Step